
A lightweight, open-source logging and network inspection SDK for Flutter.



Website · pub.dev · GitHub · Server
Capture logs and network calls on the device, then sync them to a self-hosted Code Scout dashboard for searching, filtering and watching a device live.
This is not a crash reporter. Crashlytics tells you the app crashed. Code Scout shows you what it was doing for the five minutes before. Plenty of teams run both.
You do not need a server to start. Add the package, tap the floating button, and read your logs and network calls on the phone. That is a real way to use it rather than a trial version. Add credentials later, when you want them somewhere you can search.
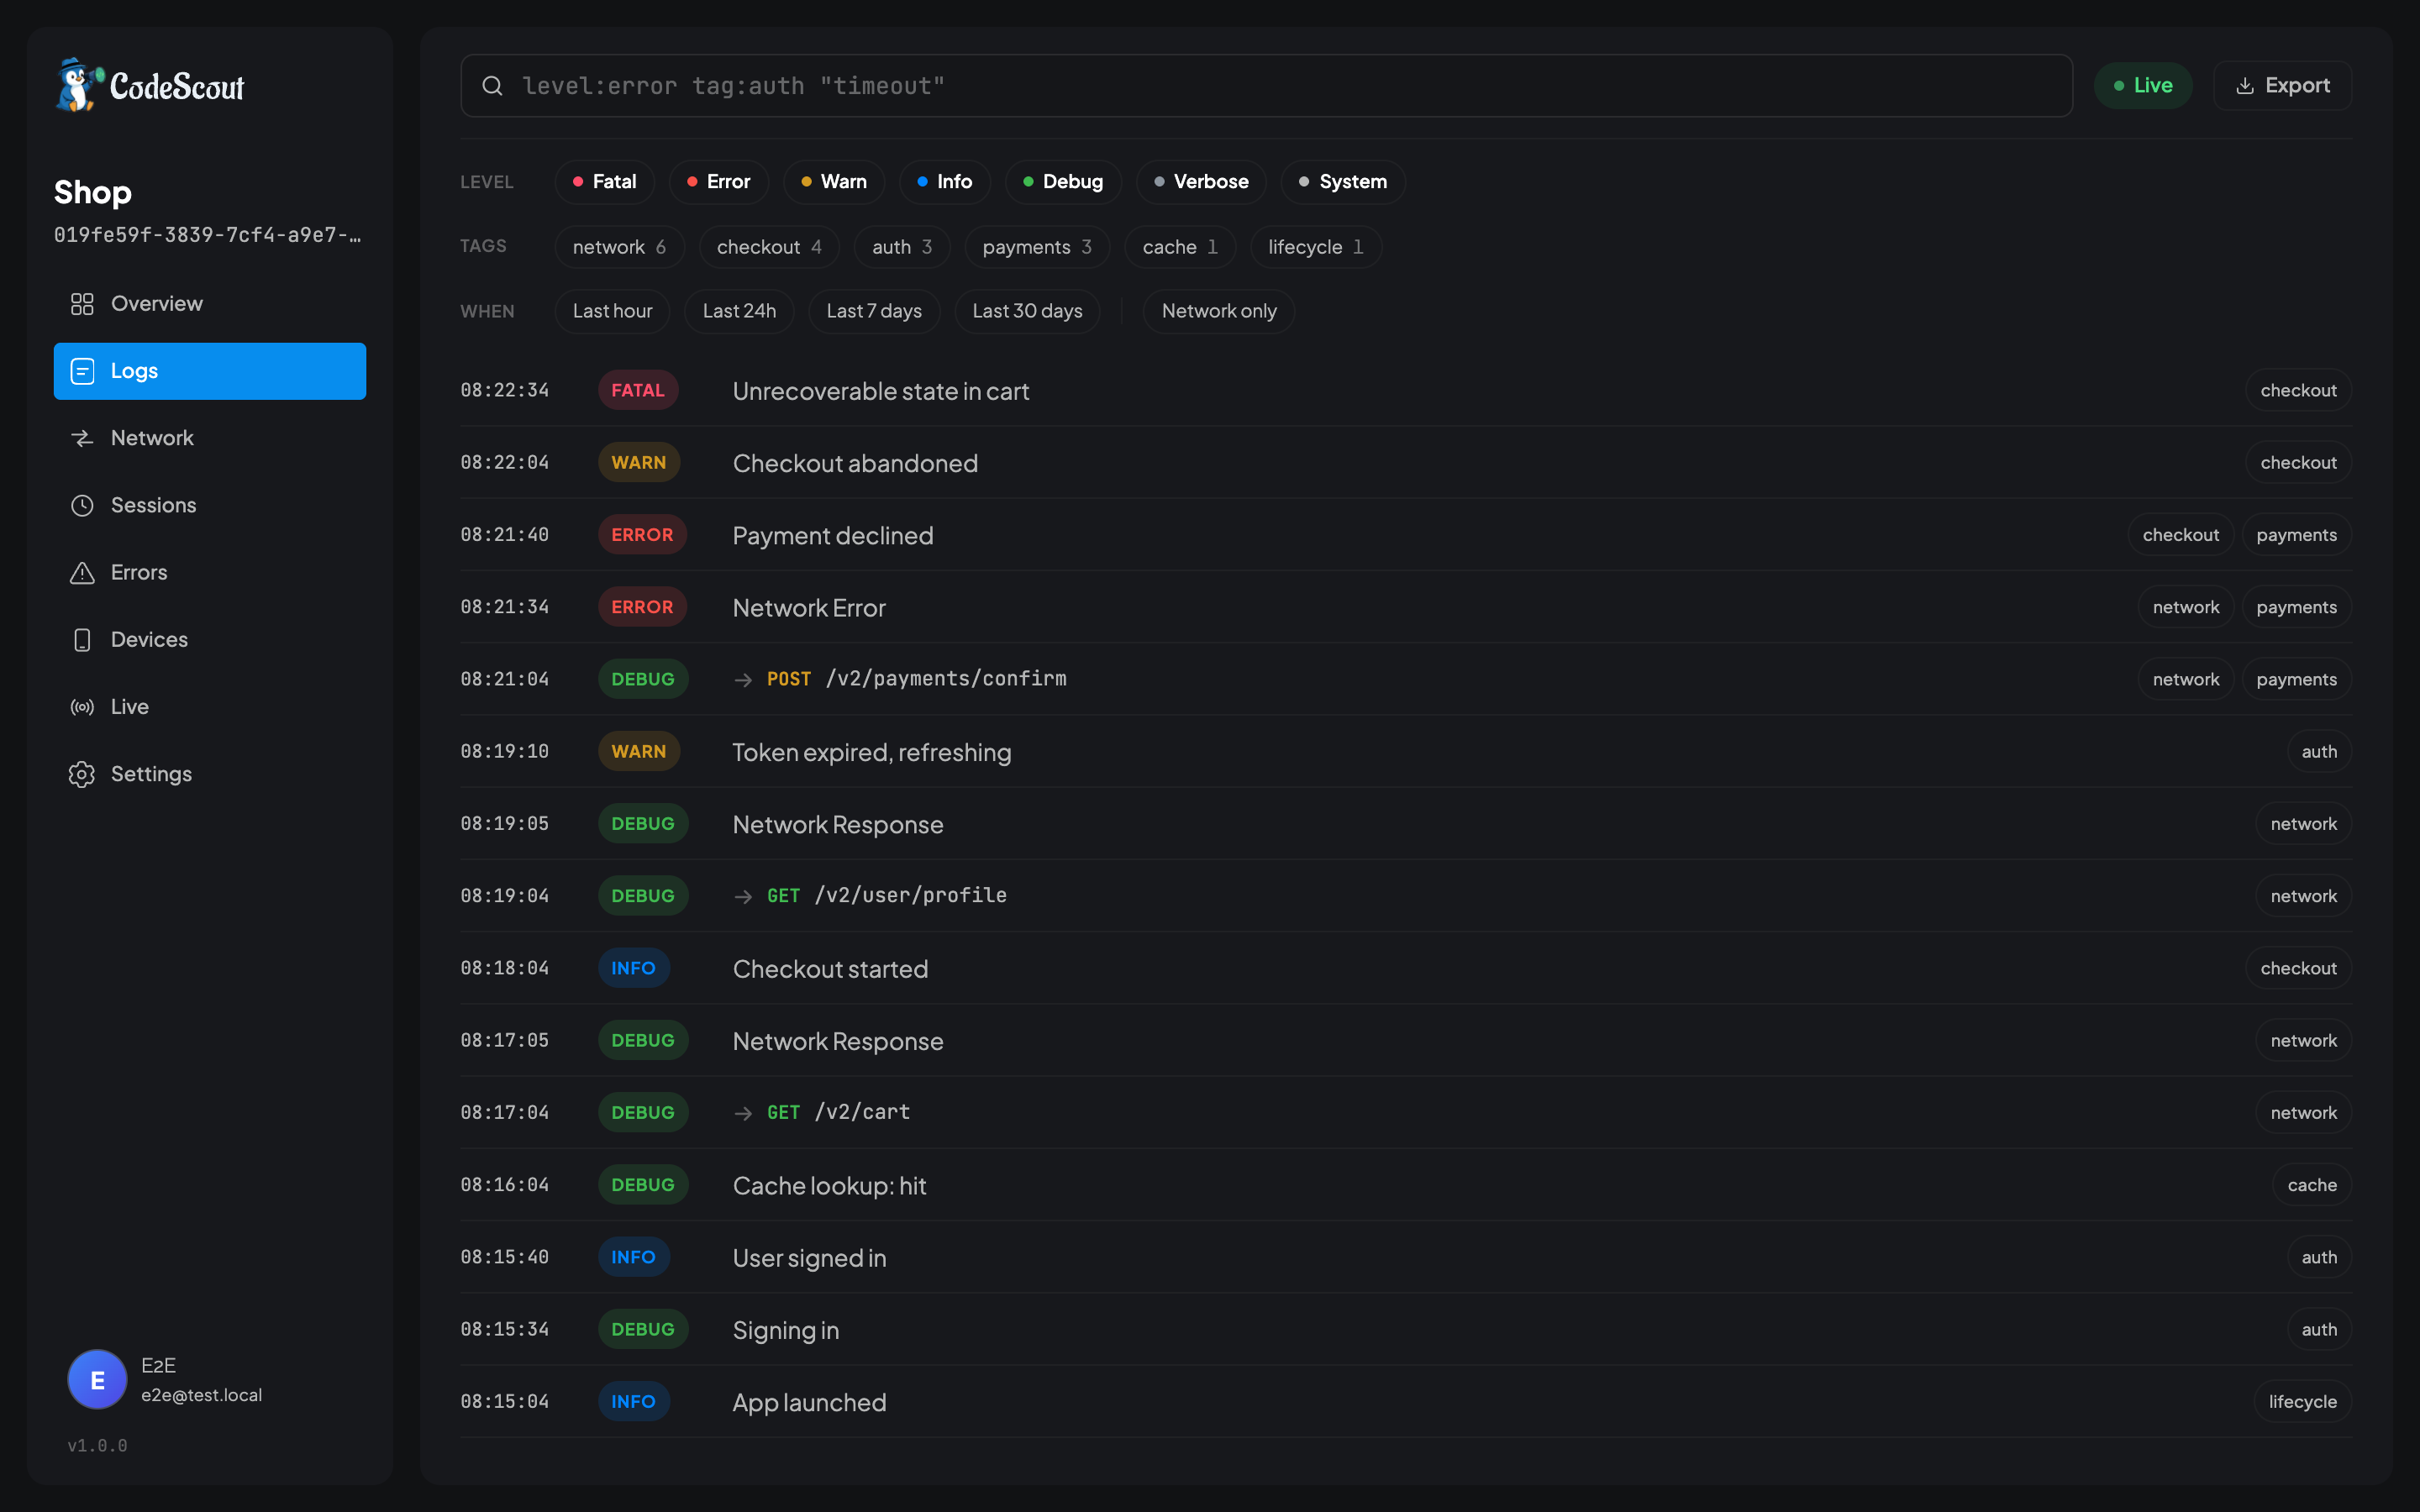
Where your logs end up, if you point it at a dashboard.
- Structured logging with levels (debug, info, warning, error, fatal), tags, and metadata
- Network interception for Dio and
http. Correlates request, response, and error by request ID - Backs off when told to. A throttled or busy server is honoured, not retried into the ground
- Redaction you control. Name what to strip and it never reaches disk or the network; name nothing and you see exactly what your app sent
- Sessions and devices. Every app launch is recorded with the device it ran on and the build it was, so you can ask what happened on one phone
- Local persistence in SQLite so logs survive app restarts
- Automatic batch sync. Compresses logs to tar.gz and uploads on a configurable interval
- Zero third-party HTTP deps. All server communication uses
dart:io - In-app overlay. Read your logs and network calls on the device, with no server needed at all
- Lightweight, designed to add minimal overhead to your app
| Package | Description | pub.dev |
|---|---|---|
| code_scout | Core logging SDK | |
| code_scout_dio | Dio interceptor |  |
| code_scout_http | HTTP client wrapper |  |
| code_scout_talker | Talker observer |  |
Install the core package:
flutter pub add code_scoutFor network interception, add the companion package for your HTTP client:
# For Dio users
flutter pub add code_scout_dio

# For http users
flutter pub add code_scout_http
Already using Talker? Keep it. One observer sends everything it already logs to the dashboard as well, and none of your logging code changes:
flutter pub add code_scout_talkerfinal talker = Talker(observer: const CodeScoutTalkerObserver());Call init() early in your app (e.g. after the first frame):
import 'package:code_scout/code_scout.dart';

await CodeScout.instance.init(
  freshContextFetcher: () => context,
  configuration: CodeScoutConfiguration(
    logging: LoggingBehavior(minimumLevel: LogLevel.all),
    projectCredentials: ProjectCredentials(
      link: 'http://your-server:24275/',
      projectID: 'your-project-id',
      projectSecret: 'your-project-secret',
    ),
    sync: LogSyncBehavior(
      syncInterval: Duration(seconds: 30),
      maxBatchSize: 100,
    ),
  ),
);Use the shorthand methods for quick logging:
final scout = CodeScout.instance;

scout.d('Fetching user profile');                       // debug
scout.i('User signed in', tags: {'auth'});              // info
scout.w('Cache miss', metadata: {'key': 'user_prefs'}); // warning
scout.e('Payment failed', error: e, stackTrace: st);    // error
scout.f('Unrecoverable state');                          // fatal
scout.v('Detailed trace data');                          // verbose
You can also use the full form when you need to specify the level dynamically:
CodeScout.instance.log(
  level: LogLevel.info,
  message: 'User signed in',
  tags: {'auth'},
  metadata: {'userId': '123'},
);

// Awaitable (if you need to confirm persistence)
await CodeScout.instance.logMessage(
  level: LogLevel.error,
  message: 'Payment failed',
  error: exception,
  stackTrace: stackTrace,
);Network interception is provided through separate companion packages so the core SDK stays dependency-free. Each package is a one-liner to set up.
Add code_scout_dio to your dependencies, then attach the interceptor:
import 'package:code_scout_dio/code_scout_dio.dart';

final dio = Dio();
dio.interceptors.add(CodeScoutDioInterceptor());
Every request, response, and error flowing through this Dio instance will be automatically captured.
Add code_scout_http to your dependencies, then wrap your client:
import 'package:code_scout_http/code_scout_http.dart';
import 'package:http/http.dart' as http;

final client = CodeScoutHttpClient(client: http.Client());

// Use it like a normal http.Client
final response = await client.get(Uri.parse('https://api.example.com/data'));
CodeScoutHttpClient extends http.BaseClient, so it's a drop-in replacement anywhere you use http.Client.
Both interceptors call NetworkManager.i.processNetworkRequest/Response/Error() under the hood. Each network call gets a unique requestId that correlates the request, response, and error phases together, giving you a complete picture of every API call.
Every app launch is a session. By default a session is anonymous, and Code Scout never guesses who someone is. Call setUser when you know:
await CodeScout.instance.setUser('u_8812');

// With traits, which are stored against this session
await CodeScout.instance.setUser('u_8812', traits: {'plan': 'free'});

// On sign out
await CodeScout.instance.setUser(null);
The id is stored and never parsed, so hash it first if you would rather Code Scout never held the real one. Traits sit on the session rather than on the person, because what matters while debugging is what was true when it broke, not what is true now.
You can call this at any point in a launch. The session record is re-sent with every upload, so a call made ten minutes in reaches the dashboard on the next sync.
Alongside the id and the user, each session carries the device it ran on and the build of your app it was:
| Field | Where it comes from |
|---|---|
| Device model | device_info_plus, for example "Pixel 7", "iPhone 15 Pro" |
| OS name and version | "Android 14", "iOS 17.4" |
| App version and build | package_info_plus, for example "3.11.2+418" |
| Installation id | A random value written once and kept for the life of the install |
The installation id is what lets the dashboard group launches by phone. It is generated locally, carries nothing personal, and goes away when the app is uninstalled. Set captureDeviceInfo: false or captureAppContext: false on LoggingBehavior to leave either group out.
Redaction is opt-in. Out of the box Code Scout records what your app sent, unchanged, because this is a debugging tool, and the token is sometimes the exact reason a request is failing.
Name what you want stripped and it is replaced at capture, before the log reaches SQLite, so it is never written to disk or uploaded:
CodeScoutConfiguration(
  redaction: RedactionBehavior(
    headers: {'authorization', 'cookie'},
    bodyKeys: {'password', 'card_number'},
  ),
)
In the dashboard that reads as a deliberate absence rather than a missing field:
authorization  ••••••  redacted on the device
content-type   application/json
There are two lists of the usual suspects, RedactionBehavior.commonHeaders and RedactionBehavior.commonBodyKeys, so you do not have to type them. They do nothing until you ask for them:
// The common lists, plus your own
RedactionBehavior.recommended(bodyKeys: {'order_signature'})

// The common lists, minus the header you are debugging today
RedactionBehavior(
  headers: RedactionBehavior.commonHeaders.difference({'authorization'}),
  bodyKeys: RedactionBehavior.commonBodyKeys,
)
Body keys match at any depth, including inside lists, ignoring case and separators, so one access_token entry covers accessToken and Access-Token too. Header names match case-insensitively.
Body size caps are separate, and on by default at 32 KB. That is not about secrets: a single response can be megabytes, and uploading it from a phone is a cost the person holding it pays. Oversized bodies are truncated with a note saying how much was dropped. Set maxBodyBytes: 0 to keep everything.
A busy app can generate hundreds of logs per session, and you rarely need all of them from all of your users. Session sampling records a share of launches instead of every one:
LoggingBehavior(sessionSampleRate: 0.05) // one launch in twentyIt samples whole sessions, not individual logs. A launch is either recorded or it is not, decided once when init() runs. That is deliberate: sampling individual logs would leave holes in a timeline, and a timeline with holes reads as your app doing nothing when really you just were not told. One in twenty complete stories is far more useful than one in twenty of every story's sentences.
The rate can also be set per project in the dashboard, under project settings. The SDK reads it from the call it already makes at startup and uses whichever rate is lower. So you can turn the volume down from the server without shipping a release, but the server can never make your app send more than you asked for. If the server cannot be reached, your own setting stands.
Sampling only affects what is stored and uploaded. The console and the in-app overlay show every log either way, so a sampled-out launch is not a launch you cannot debug on the device in front of you.
A floating button draws over your app. Tapping it opens a sheet with three tabs:
- Logs. Everything this launch has logged, newest first, with the same level and tag filters the dashboard has. Tap a row to see its error, stack trace and metadata.
- Network. Request, response and error paired into one row per call, with the status and how long it took.
- Session. The session id, installation id, device, app version and user. Long-press any of them to copy, which is what you want when filing a bug.
It reads an in-memory buffer of the current launch rather than the server, so it works with no server configured at all. Drop the package in, tap the button, read your logs.
CodeScout.instance.showIcon();   // Show floating button
CodeScout.instance.hideIcon();   // Hide it
CodeScout.instance.toggleIcon(); // ToggleWhen you need to see what a phone is doing right now, usually QA on one desk and a developer on another, pair the two:
- On the dashboard, open the project's Live devices and press New session. It shows a six character code.
- On the phone, open the Code Scout overlay, go to the Live tab, type the code, and press Connect.
Every log that launch produces now arrives on the dashboard as it happens, with the same level filters the log viewer has. Filter to a tag, tap through a flow, and watch the events confirm.
The session ends when you stop it, when the app closes, or when the network drops. Nothing streamed is stored on the server unless somebody turns on Persist, so this is safe to point at a build you would not want in your logs.
You can drive it yourself instead of using the overlay:
final started = await CodeScout.instance.startLiveSession('4K7Q2P');
// ...
await CodeScout.instance.stopLiveSession();
startLiveSession never throws. A mistyped or expired code comes back as
false. Sampling does not apply to a live session: if somebody is watching,
they see everything.
await CodeScout.instance.dispose();Flutter App Code Scout Server
┌─────────────────────────┐ ┌─────────────────────────┐
│ CodeScout.log() │ │ │
│ NetworkManager │ │ POST /api/logs/dump │
│ | │ │ (multipart tar.gz) │
│ LogPersistenceService │ periodic │ | │
│ (SQLite) │──sync───────> │ Log ingestion │
│ | │ tar.gz │ | │
│ LogSyncWorker │ X-Project-ID │ Postgres storage │
│ LogCompressor (isolate) │ │ | │
└─────────────────────────┘ │ Web Dashboard │
└─────────────────────────┘
- Logs are written to a local SQLite database
- A periodic timer picks up unsync'd logs, marks them as syncing, compresses them in a background isolate, and uploads via
dart:io - On success, logs are deleted locally. On failure, they're rolled back and retried next cycle
- After 5 consecutive failures the sync worker stops automatically to avoid battery drain
- A
429or503is not a failure. The worker readsRetry-After, goes quiet for that long, and resumes. It never counts toward the auto-stop, so a server protecting itself can never permanently silence an SDK - A
413halves the batch and retries, growing back on success
| Option | Default | Description |
|---|---|---|
LoggingBehavior.minimumLevel |
LogLevel.info |
Minimum level to capture |
LoggingBehavior.enabledTags |
{'*'} |
Tags to capture (* = all) |
LoggingBehavior.printToConsole |
true in debug |
Print logs to console |
LoggingBehavior.includeCurrentStackTrace |
false |
Attach stack trace to every log |
LoggingBehavior.captureDeviceInfo |
true |
Record the device model, OS name and version |
LoggingBehavior.captureAppContext |
true |
Record your app's version and build number |
LoggingBehavior.sessionSampleRate |
1.0 |
Share of launches recorded. The project's server-side rate can lower this, never raise it |
RedactionBehavior.headers |
{} |
Header names to redact. Nothing by default |
RedactionBehavior.bodyKeys |
{} |
Body and metadata keys to redact. Nothing by default |
RedactionBehavior.maxBodyBytes |
32 KB | Bodies larger than this are truncated |
LogSyncBehavior.syncInterval |
5 minutes | How often to sync |
LogSyncBehavior.maxBatchSize |
100 | Max logs per upload |
Only needed if you want a dashboard. Without one the SDK still prints to the console and fills the on-device viewer.
git clone https://github.com/getcodescout/code_scout.git
cd code_scout
docker compose up
Open http://localhost:24275, register the first account, and create a project. The project ID and
secret appear on the last step of the wizard, and you can read the secret again later under
Settings → SDK setup. Put both into ProjectCredentials.
Full instructions: codescout.tech/docs and the dashboard repository.
Pull requests are welcome. Small ones are the easiest to accept, and for anything large please open an issue first so we can check it fits.
See CONTRIBUTING.md for how to get set up, how to run the tests across all four packages, and the two analyzer traps that catch everyone the first time.
Every change ships with a test, and the honest way to check one is to undo the fix and watch the test fail.
Please report vulnerabilities privately rather than as an issue. See SECURITY.md, which also explains the things that look like bugs but are deliberate, such as nothing being redacted unless your app asks.
MIT. See LICENSE.