




A Model Context Protocol (MCP) server that gives AI assistants tools to analyze Salesforce Apex debug logs — surfacing performance bottlenecks, slow methods, and governor limit usage.
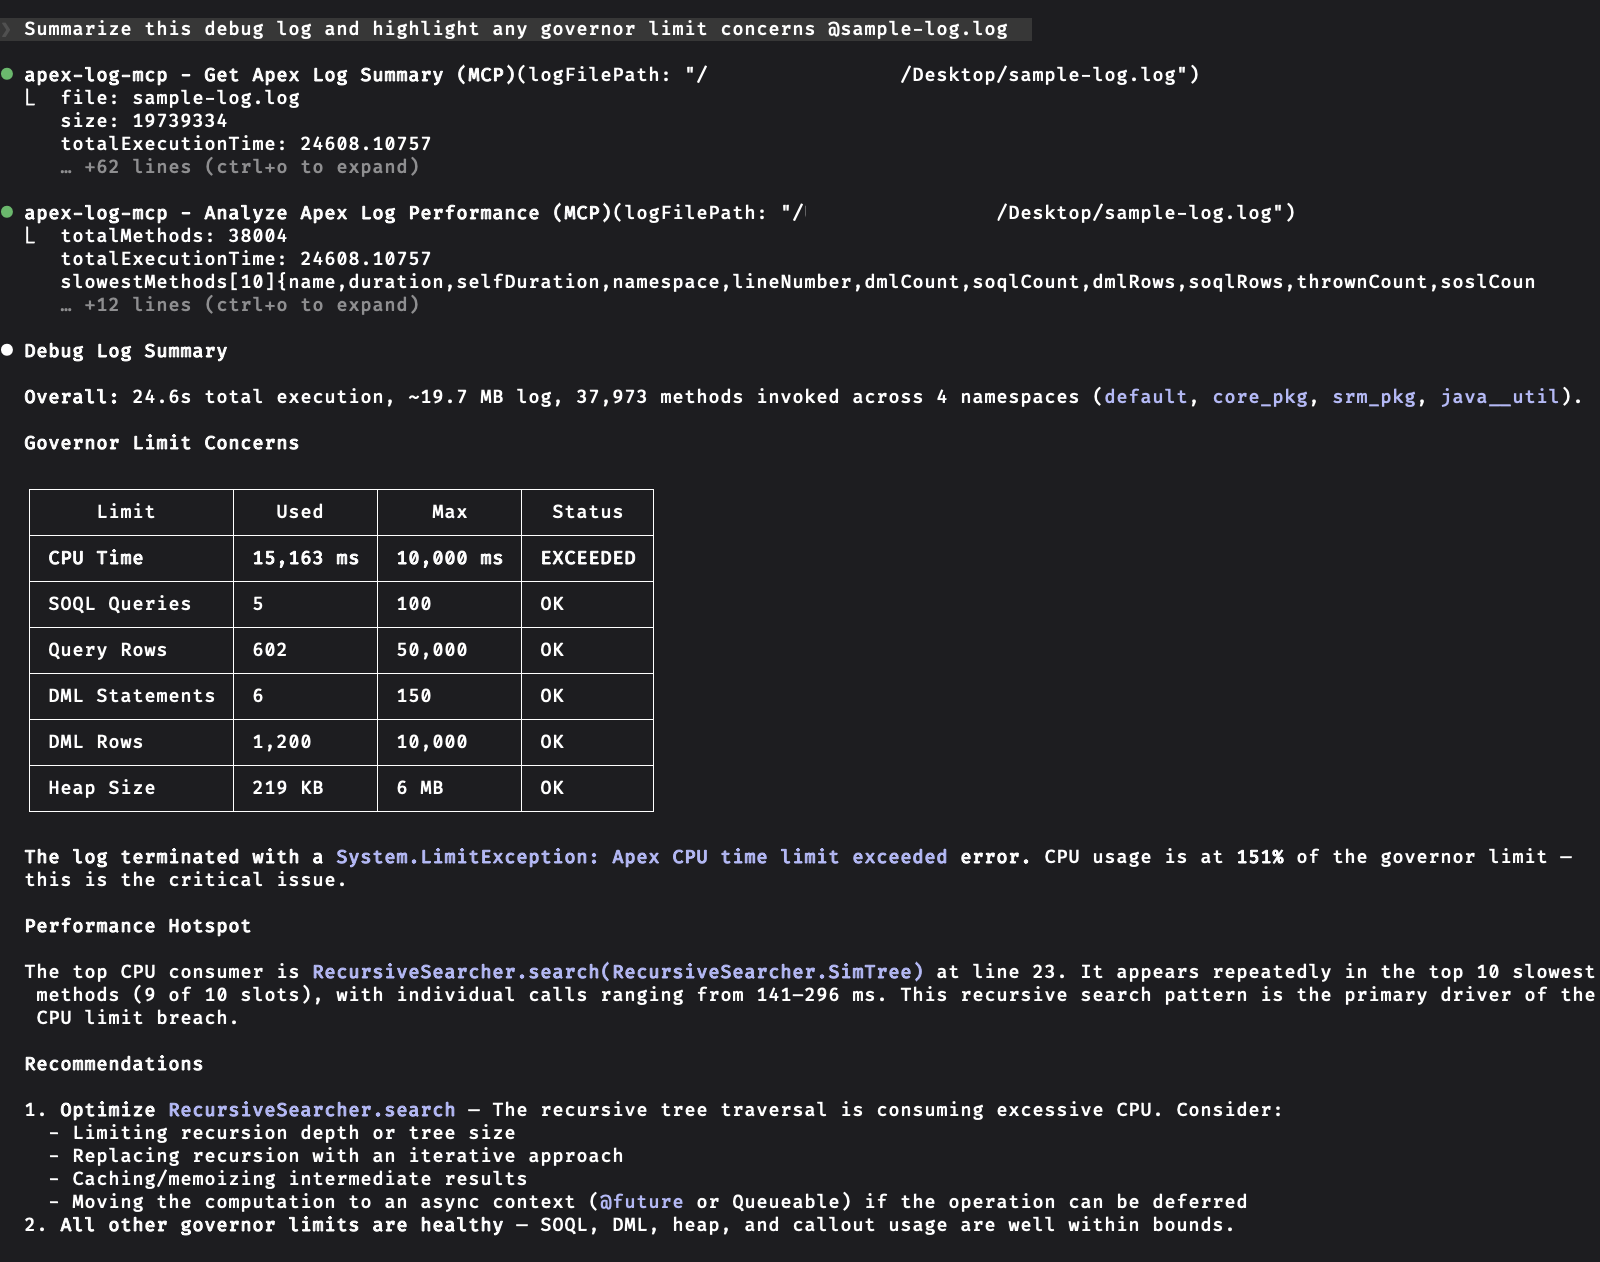
Give your AI assistant — Claude, Copilot, or any MCP-compatible client — the ability to parse Apex debug logs and surface the performance insights that matter. Instead of scrolling through thousands of log lines, ask your assistant to find what's slow and why.
Powered by the same powerful log parser as the Apex Log Analyzer VS Code extension used by thousands of Salesforce developers.
Quick Start | What You Can Do | Token Cost | Tools Reference | Configuration | How It Works | Documentation | Contributing | Contributors | License
Requirements: Node.js 22 or later.
The apexlog_execute_anonymous tool additionally needs an org authenticated with the Salesforce CLI.
Add to your MCP client configuration (claude_desktop_config.json, VS Code mcp.json, etc.):
{
  "mcpServers": {
    "apex-log-mcp": {
      "command": "npx",
      "args": ["-y", "@certinia/apex-log-mcp"]
    }
  }
}
That's it. Open a conversation and ask your AI assistant to analyze an Apex debug log.
Ask your AI assistant to work with Apex debug logs using natural language:
- "Give me a summary of this debug log"
- "Show me the 5 slowest methods in the default namespace"
- "Are we approaching any governor limits in this transaction?"
- "Run this Apex against my scratch org and analyze the performance"
Every request carries all four tool definitions, whether or not a tool is called. That is the standing cost of having the server connected, and each figure is the whole definition as the client receives it — name, title, description, input schema and annotations together.
| Tool | Tokens | 1.x | Change |
|---|---|---|---|
apexlog_execute_anonymous |
~421 | ~844 | -50% |
apexlog_list_slow_operations |
~377 | ~247 | +53% |
apexlog_list_limit_risks |
~192 | ~267 | -28% |
apexlog_get_summary |
~163 | ~171 | -5% |
| Total | ~1,153 (0.6% of a 200K context) | ~1,529 | -25% |
The input side is the same for every analysis tool — a tool name and a log file path, about 15 tokens — so what a call costs is what it returns. Each row is one tool answering one of the logs in tests/eval/fixtures/, beside what 1.x returned for the same log — the same facts, in a cheaper shape.
| Tool | Log | Response | 1.x | Change |
|---|---|---|---|---|
apexlog_get_summary |
governor-heavy.log |
~341 | ~293 | +16% |
apexlog_get_summary |
minimal.log |
~238 | ~249 | -4% |
apexlog_list_slow_operations |
governor-heavy.log |
~390 | ~408 | -4% |
apexlog_list_slow_operations |
minimal.log |
~111 | ~190 | -42% |
apexlog_list_limit_risks |
governor-heavy.log |
~39 | ~84 | -54% |
apexlog_list_limit_risks |
minimal.log |
~24 | ~30 | -20% |
All tools return TOON-encoded data, kept deliberately lean to save tokens — without dropping anything you might need to ask about. See Token Cost for what that is worth in practice.
- Every governor limit, debug category and operation column is returned, including the ones at zero. "How many DML statements did this consume?" is answerable from the response, and
0means none rather than not measured. - The leanness comes from shape. Data that used to be nested objects is returned as flat tables, which TOON encodes as one header plus one line per row.
- Nothing is reported twice. No prose summary restates the numbers in the table alongside it, and no figure appears in two places.
- Durations are rounded to 3 decimal places (ms) and percentages to 1.
- Only lists of things that happened are omitted when empty — log issues. Nothing to report means the key is absent.
Rank what an Apex debug log spent its time on by self-execution time — code units, managed packages, methods, queries, searches, DML, flows and workflows in one table, each row with its calls, durations (in ms), database counts and rows. Best for finding what to optimize.
Rows are {kind, name, namespace, callCount, durationTotalMs, durationSelfMs, selfPercentage, soqlCount, dmlCount, soslCount, rowCount, thrownCount}, beside the transaction's durationTotalMs and the returnedSelfPercentage the returned rows account for between them.
kind is one of codeUnit, managedPackage, method, systemMethod, soql, sosl, dml, flow or workflow. A managedPackage row is the time a package spent where the log shows nothing, and is often most of a transaction.
| Parameter | Type | Required | Description |
|---|---|---|---|
logFilePath |
string | Yes | Absolute path to the Apex debug log file (.log) |
kind |
string | No | Rank only operations of this kind |
namespace |
string | No | Rank only this namespace |
minSelfMs |
number | No | Drop operations below this self time (default: 0) |
limit |
number | No | Rows to return (default: 10) |
groupBy |
string | No | Fold repeats into one row by name (default), namespace or callerNamespace; none ranks each call |
Get a high-level summary of an Apex debug log: how long the transaction ran (in ms), where the time went by kind of operation, every governor limit it and each namespace consumed, the debug levels it was logged at, and whether the log is complete. Best for a quick overview before deeper analysis.
All thirteen governor limits are listed as {limit, used, max} rows, at zero included, so you can ask what a transaction consumed and get an answer either way. limitsByNamespace adds {namespace, limit, used} rows for each limit a namespace consumed, which is how you see that a managed package spent your CPU time; it names no ceiling, because the parser keeps one ceiling per limit for the whole transaction and it is already in governorLimits.
timeByKind gives {kind, logCategory, operationCount, durationSelfMs, selfPercentage} for every kind apexlog_list_slow_operations ranks. logCategory is the trace category that decides whether the kind reaches the log at all, so a zero can be read: soql 0 beside DB NONE in debugLevels, whose rows are {logCategory, level}, means the queries were not logged, and beside DB FINEST it means none ran.
| Parameter | Type | Required | Description |
|---|---|---|---|
logFilePath |
string | Yes | Absolute path to the Apex debug log file (.log) |
List the governor limits an Apex log transaction has nearly consumed — CPU time, heap, SOQL and SOSL queries, DML statements, and the rows each returned or wrote — worst first, with how much of each was used. Best for checking whether a transaction is at risk of failing on a limit.
Rows are {limit, used, max, usedPercentage}. The threshold that produced them is reported alongside, so an empty table reads as "nothing is that far consumed" rather than as a missing answer.
| Parameter | Type | Required | Description |
|---|---|---|---|
logFilePath |
string | Yes | Absolute path to the Apex debug log file (.log) |
threshold |
number | No | Report a limit once it is this percentage consumed (default: 80) |
Executes anonymous Apex code against any authenticated Salesforce org. Saves the resulting debug log to a local file and returns a summary with the file path. Use the file path with apexlog_get_summary, apexlog_list_slow_operations, or apexlog_list_limit_risks for deeper analysis.
| Parameter | Type | Required | Description |
|---|---|---|---|
apex |
string | Yes | The anonymous Apex to be executed |
targetOrg |
string | No | Alias or username of the target Salesforce org. Uses the project default if not specified. |
outputDir |
string | No | Directory to save the debug log file. Defaults to .apex-log-mcp/ in the project root. |
debugLevel |
string | object | No | Trace-flag log levels — see the options below. Omit to keep the current config. |
debugLevel options — omit to keep the current config, or pass one of:
-
"default"— reset every category to its default. -
a log level (e.g.
"FINEST") — set every category to that level. -
an object — override specific categories only; the rest keep their defaults:
{ "database": "FINEST", "apexCode": "FINE" }
Valid levels: NONE, ERROR, WARN, INFO, DEBUG, FINE, FINER, FINEST.
📋 Default debug levels — used when debugLevel is omitted (click to expand)
| Category | Default Level |
|---|---|
apexCode |
FINE |
apexProfiling |
FINE |
callout |
DEBUG |
database |
FINEST |
nba |
INFO |
system |
DEBUG |
validation |
DEBUG |
visualforce |
FINE |
wave |
INFO |
workflow |
FINE |
Example prompts:
- "Execute this Apex and show me the log:
System.debug('Hello');" - "Run a query for all Accounts and analyze the performance"
- "Execute this Apex with all debug levels set to FINEST"
- "Run this Apex against my QA org with database logging set to FINEST"
Note: Uses the project's default org unless
targetOrgis specified. Sandbox, scratch, Developer Edition and trial orgs run without prompting; production orgs are gated — see Production safety. The debug log is saved to a local file (default:.apex-log-mcp/) and the response includes the file path, org username (and alias, if set), org type, and execution summary. Add.apex-log-mcp/to your.gitignoreto avoid committing debug logs.
The Quick Start configuration is all you need — all four tools are available by default. The sections below cover the production safety policy and how to change it.
apexlog_execute_anonymous runs arbitrary Apex, so before running anything the server identifies what kind of org it is pointed at. It asks the org once per session:
| Org type | Identified by | Behaviour |
|---|---|---|
sandbox |
IsSandbox, no trial expiry |
Runs |
scratch |
IsSandbox with a trial expiry |
Runs |
trial |
Not a sandbox, has a trial expiry | Runs |
developer |
Developer Edition | Runs |
production |
Anything else | Confirmation required |
unknown |
The org could not be queried | Confirmation required |
For a production org, the server:
- Runs it anyway if the server was started with
--allow-production-orgs. - Otherwise asks you to confirm, if your MCP client supports elicitation. The prompt names the org and shows the Apex.
- Otherwise refuses, and the error explains both ways to proceed.
An org that cannot be identified is treated as production, so a network or permissions problem can never silently downgrade a production org.
| Flag | Description |
|---|---|
--allow-production-orgs |
Treat production orgs like any other — no confirmation prompt, no refusal. Only set this if production targets are intentional. |
--no-apex-execution |
Disable Apex execution entirely. The tool stays visible so agents know it exists, but every call is refused. The three log analysis tools are unaffected. |
For an analysis-only deployment:
{
  "mcpServers": {
    "apex-log-mcp": {
      "command": "npx",
      "args": ["-y", "@certinia/apex-log-mcp", "--no-apex-execution"]
    }
  }
}This server implements the Model Context Protocol (MCP) to expose Apex log analysis as tools that any MCP-compatible AI client can call.
- Runs as a local process — your AI client spawns the server and communicates locally. No network requests, no API keys.
- Uses the same parser as the Apex Log Analyzer VS Code extension — battle-tested parsing of the Apex debug log format.
- Returns structured data — all durations in milliseconds, governor limits as used/max rows, operations with SOQL/DML counts — so your AI assistant can reason about the results.
- Keeps responses lean — TOON tables and no duplicated figures, so more of the context window is left for reasoning. The fields stay, including the ones at zero: see Tools Reference.
- Parses a log once, not once per tool — a summary followed by a deeper analysis of the same file reuses the parse, so a large log is read and parsed one time.
- Apex Log Analyzer VS Code Extension — Full-featured Apex log analyzer for VS Code
We welcome contributions! Please see our Contributing Guide for details.
- Developing — Set up your development environment
- Code of Conduct — Community guidelines
Thanks to our amazing contributors!
Copyright © Certinia Inc. All rights reserved.
